Happiness
Part of the Life Well Spent Report 2025
They’re called our ‘golden years’ for a reason, but how much happier are we in later life?

Happiness rises with age
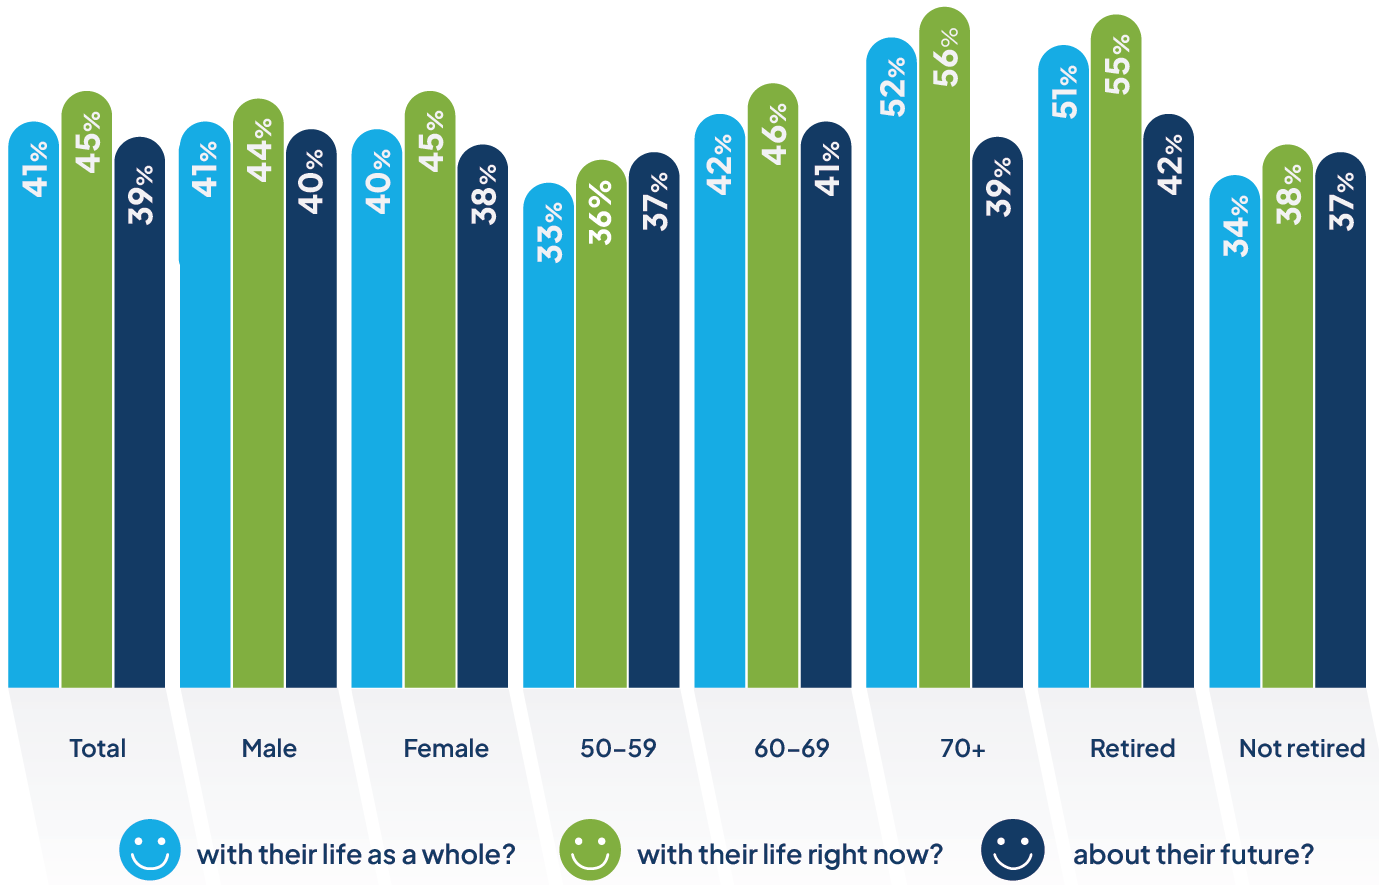
When we asked people to rate “how satisfied are you with your life as a whole nowadays” out of 10, 72% answered 6 or above (exactly the same as in 2024). And 41% rated their life satisfaction an 8, 9 or 10 – also the same as last year.
Happiness rises both with age and upon retirement. 51% (-1%) of retirees score 8 or higher for overall life satisfaction, compared to just 34% of those who are still working. And 52% of people over 70 also gave these higher happiness scores.
What's more, the number of people who rate their outlook as between 1 and 4 out of 10 has gone down by 1% to 15%. That's also 4% less than in 2022 when we released our first report.
Who is happiest...
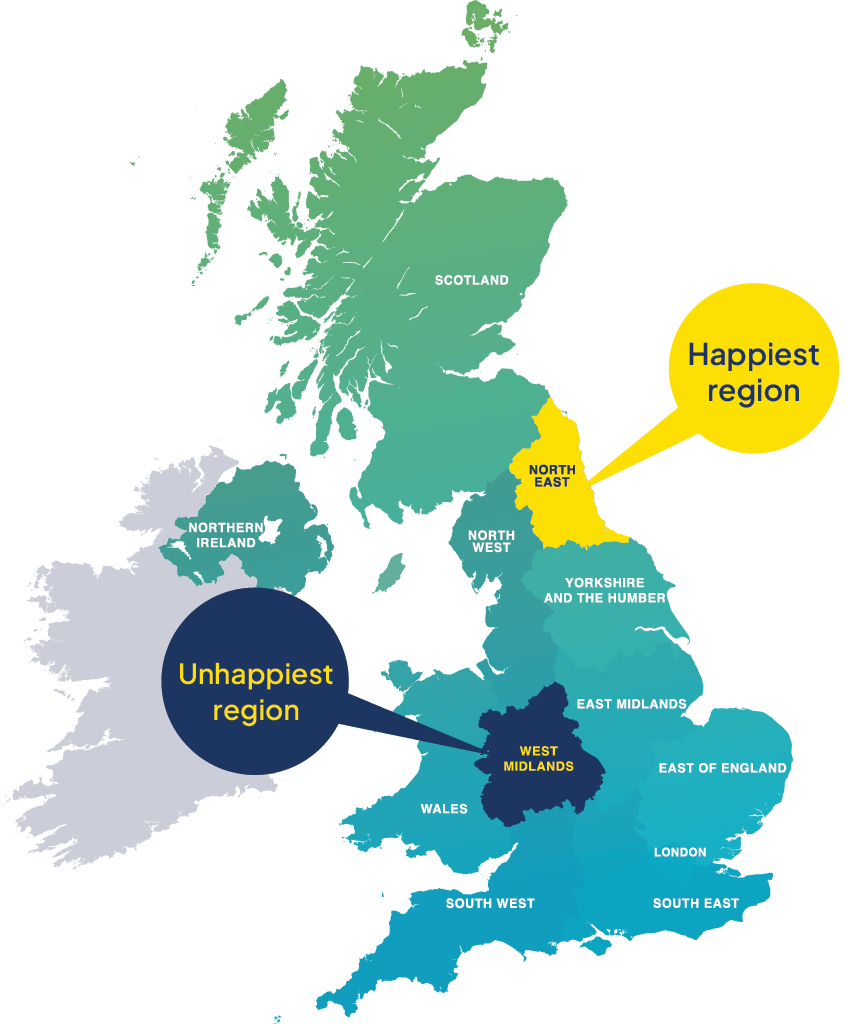
Happiness varies by region
Similar results can be seen when asked “how happy did you feel yesterday?”, with 56% of over 70s reporting high happiness, and 55% of retirees. This is compared to just 36% of 50 to 59-year-olds, and 46% of 60 to 69-year-olds.
In 2025, Wales has been overtaken as the happiest region by North East England, with 48% rating their overall happiness at 8 to 10 out of 10. This is closely followed by East Anglia at 44% – quite the turnaround, as this region was one of the least happy in 2024! The least happy region is the West Midlands, where only 35% feel the same.
Retirees are the most optimistic
Like last year, 39% of people feel very positive about their future. Retirees show the most optimism, with 42% (-1%) feeling very happy about the future. This could mean the anticipation of retirement, and the initial ‘high’ after finally retiring, may have a big effect on our outlook.
The most optimistic age range overall, however, is found in people aged 60 to 69, with 41% feeling very happy about what's to come.
Family, friends and nature make us happy
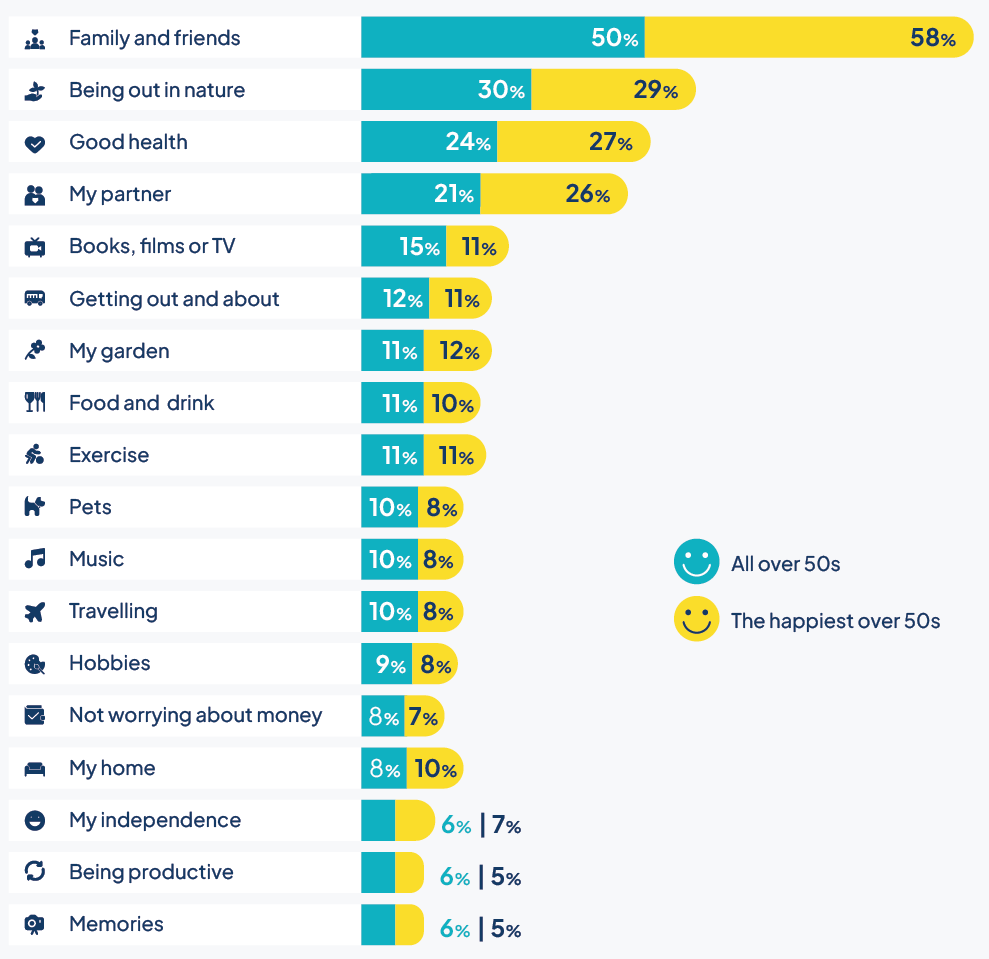
When asked what makes people happiest in life, the most popular answer is family and friends (50%). Second is being out in nature (30%), third is good health (24%), and fourth is a partner (21%).
The percentages shift if we look at what matters most to the happiest people. Family and friends keep the top spot, but with an 8% rise (58%). Being out in nature remains in second place at 29%, while good health is in third place 27%. Our partner sits at fourth place with 26%.
Those who are the least satisfied with their lives as a whole are the most likely to name having lots of money (12%) and not worrying about money (15%) as their main sources of happiness.
What makes you happy?
The happiest people work less and spend more time in nature
The most popular pastime by quite a margin – for both the average and the happiest people – is watching TV and/or films. Second is working or volunteering, although the happiest of us spend an average of 95 minutes less on this a week. This supports our finding that happiness tends to increase upon retirement.
Seeing family and friends comes third, followed by hobbies, browsing social media, and spending time in nature. For the latter, the happiest spend 43 more minutes a week in nature than the average person. The happiest also spend less time cleaning and budgeting.
Those who report the least satisfaction with their lives are most likely to not spend any time on hobbies (27%) or seeing friends and family in person (21%). This group also spends the least time in nature (3.5 hours a week) and the pub (1 hour a week). In fact, 69% of the least satisfied don't spent any time at the pub, compared to just 55% of the happiest people.
How people spend their time
| Activity | All over 50s Average hours per week spent on activity |
Happiest over 50s Average hours per week spent on activity |
Difference in minutes between the happiest vs all over 50s |
| Watching TV and/or films | 17hrs 38m | 18hrs 1m | 23m |
| Working/volunteering | 12hrs 25m | 10hrs 50m | -1hr 35m |
| Seeing family/friends in person | 5hrs 23m | 5hrs 31m | 8m |
| Hobbies | 5hrs 8m | 5hrs 49m | 41m |
| Browsing social media | 5hrs 2m | 4hrs 54m | -8m |
| Spending time in nature | 4hrs 8m | 5hrs 22m | 43m |
| Driving/using public transport | 4hrs 8m | 4hrs 29m | 21m |
| Cleaning | 4hrs 2m | 3hrs 52m | -10m |
| Watching sports | 2hrs 23m | 2hrs 26m | 3m |
| Budgeting/managing finances | 1hr 35m | 1hr 26m | -8m |
| Going to the pub | 1hr 17m | 1hr 29m | 12m |
| Learning/practicing a skill | 1hr 11m | 1hr 17m | 6m |
| Having sex | 48m | 1hr | 12m |
This article forms part of our Life Well Spent report, which looks at the relationship between happiness and big purchases in later life.